
Polestar Automotive Holding UK PLC (NASDAQ: PSNY): Corporate Profile & Financials
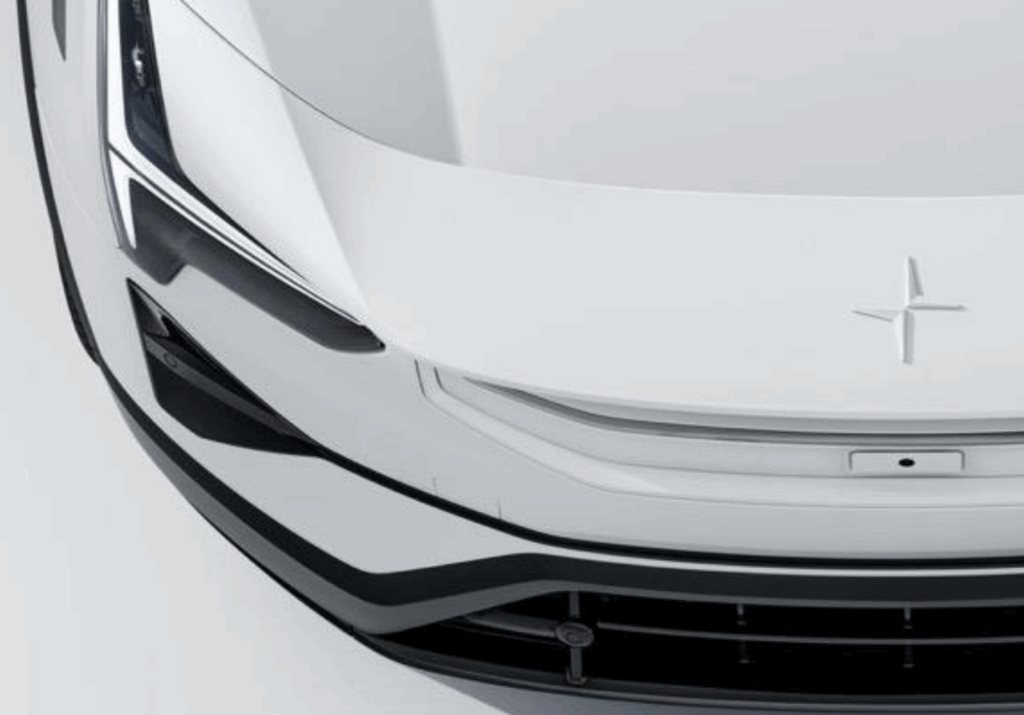
Source: Polestar Automotive Holding UK PLC Annual Report and Financial Statements for the year ended 31 December 2025.
- 1. Quick Facts / Company Snapshot
- 2. Company Overview
- 3. Business Segments
- 3.1 Revenue Contribution by Commercial Activity
- 3.2 Detailed Operational Profiles by Revenue Stream
- 3.2.1 1. Sales of Vehicles (Commercial Automotive Operations)
- 3.2.2 2. Sales of Regulatory Carbon Credits (Environmental Attribute Monetization)
- 3.2.3 3. Vehicle Leasing Revenue (Buy-Back Operating Lease Structures)
- 3.2.4 4. Sales of Licenses and Royalties (IP Monetization)
- 3.2.5 5. Sales of Software and Performance Engineered Kits
- 3.2.6 6. Other Revenue (Components & Aftermarket Accessories)
- 4. History and Evolution
- 5. Products and Services
- 5.1 Automotive Product Portfolio
- 5.1.1 1. Polestar 4 (Electric Performance SUV Coupé)
- 5.1.2 2. Polestar 2 (Electric Performance Fastback)
- 5.1.3 3. Polestar 3 (The SUV for the Electric Age)
- 5.1.4 4. Polestar 5 (Electric 4-Door Grand Tourer)
- 5.1.5 5. Polestar 6 and Polestar 7 (Future Development Pipeline)
- 5.2 Digital Services and Charging Solutions
- 6. Brand Portfolio
- 7. Geographical Presence
- 8. Profit and Loss Analysis
- 9. Balance Sheet and Financial Position
- 10. Cash Flow Dynamics
- 11. Board of Directors and Leadership Team
- 11.1 Board Composition and Committee Allocations
- 11.2 Comprehensive Biographies of Directors and Officers
- 11.2.1 Prof. Dr. h.c. Winfried Vahland (Board Chair & Independent Non-Executive Director)
- 11.2.2 Michael Lohscheller (Chief Executive Officer & Executive Director)
- 11.2.3 Cynthia Dubin (Independent Non-Executive Director & Compensation Chair)
- 11.2.4 Christine Gorjanc (Independent Non-Executive Director & Audit Committee Chair)
- 11.2.5 Dr. Karl-Thomas Neumann (Independent Non-Executive Director & NomGov Chair)
- 11.2.6 Prof. Xiaojie (Laura) Shen (Independent Non-Executive Director)
- 11.2.7 Francesca Gamboni (Non-Executive Director – Volvo Cars Representative)
- 11.2.8 Quan (Joe) Zhang (Non-Executive Director – Geely Representative)
- 12. Subsidiaries, Associates, and Joint Ventures
- 13. Other Investments and Minority Holdings
- 14. Physical Properties and Infrastructure Footprint
- 15. Founders and Corporate Heritage
- 16. Parent Company Structure
- 17. Investments and Capital Expenditure Plans
- 18. Shareholding Pattern and Capital Structure
- 19. Future Strategy and Strategic Priorities
- 20. Key Strengths
- 21. Key Challenges and Principal Risks
- 22. Environmental, Social, and Governance (ESG) Overview
- 23. Conclusion and Strategic Outlook
- 24. Frequently Asked Questions (FAQ)
- 24.1 What is Polestar Automotive Holding UK PLC?
- 24.2 How many vehicles did Polestar deliver in FY 2025?
- 24.3 What were Polestar’s primary financial results for FY 2025?
- 24.4 What models are currently in Polestar’s vehicle lineup?
- 24.5 Where are Polestar vehicles manufactured?
- 24.6 Who are the largest shareholders of Polestar?
- 24.7 What is Polestar’s climate roadmap target?
Quick Facts / Company Snapshot
| Data Metric | Company Disclosure |
| Official Full Company Name | Polestar Automotive Holding UK PLC |
| Company Registration Number | 13624182 (Registered in England and Wales) |
| Registered Corporate Office | The Pavilions, Bridgwater Road, Bristol, England, BS13 8AE |
| Global Management Headquarters | Assar Gabrielssons väg 9, 418 78 Göteborg, Sweden |
| Listing Venue & Security Form | NASDAQ (Trading as American Depositary Shares / ADSs) |
| Chief Executive Officer (CEO) | Michael Lohscheller (Appointed 1 October 2024) |
| Chairman of the Board | Prof. Dr. h.c. Winfried Vahland (Chair from 7 October 2024) |
| Chief Financial Officer (CFO) | Jean-François Mady (Appointed October 2024) |
| Total Global Headcount (Year-End 2025) | 1,868 Total Directors and Employees (1,686 core employees) |
| Commercial Footprint | 28 Active Global Markets |
| Retail & Service Network | 211 Sales Points; 1,243 Volvo Cars Partner Service Points |
| Total Annual Vehicle Deliveries (2025) | 60,119 Retail Units (34% YoY Growth) |
| Total Revenue (FY 2025) | $3,058,109 thousand ($3.058 billion) |
| Gross Loss (FY 2025) | $(1,083,910) thousand ($(1.084 billion)) |
| Operating Loss (FY 2025) | $(2,009,257) thousand ($(2.009 billion)) |
| Net Loss (FY 2025) | $(2,357,231) thousand ($(2.357 billion)) |
| Adjusted EBITDA (FY 2025) | $(783,355) thousand (Non-GAAP Measure) |
| Total Assets (as of 31 Dec 2025) | $3,929,815 thousand ($3.930 billion) |
| Total Liabilities (as of 31 Dec 2025) | $(9,052,036) thousand ($(9.052 billion)) |
| Cash and Cash Equivalents (Year-End 2025) | $1,159,300 thousand ($1.159 billion) |
Source: Polestar Automotive Holding UK PLC Annual Report and Financial Statements for the year ended 31 December 2025.
Company Overview
Polestar Automotive Holding UK PLC is a pure-play, premium electric vehicle (BEV) manufacturer established in 2017 through a joint foundation by Volvo Cars and Zhejiang Geely Holding Group. Headquartered in Gothenburg, Sweden, the enterprise operates as Europe’s only dedicated pure electric player without legacy internal combustion engine (ICE) commitments. Polestar leverages a capital-efficient, asset-light contract manufacturing model, utilizing the advanced engineering, technology access, and large-scale manufacturing infrastructure of its founding industrial partners.
The company’s commercial reach spans 28 active international markets across Europe, North America, and the Asia-Pacific region. Polestar’s vehicles are manufactured on two continents, with active production lines in China (Taizhou, Chengdu, Hangzhou Bay, and Wuhan) and North America (Charleston, South Carolina), alongside additional contract manufacturing in Busan, South Korea. Global retail distribution is backed by a hybrid network comprising 211 dedicated sales points and 1,243 customer service locations accessed through the established Volvo Cars international service network.
- Core Operational Scope: Design, research, development, branding, marketing, and commercialization of performance electric vehicles.
- Headquarters & Registration: Management headquarters based in Gothenburg, Sweden; incorporated as a public limited company in England and Wales (Company No. 13624182).
- Commercial Transformation: Accelerating the rollout of a non-genuine agency sales model to drive active selling across major metropolitan corridors.
- Industrial Backing: Technical and operational synergies shared with Volvo Car Group and Geely Sweden Holdings AB.
The organizational structure is directed toward rapid scale and product diversification. For the financial year ended December 31, 2025, Polestar recorded total retail sales of 60,119 vehicles, representing a 34% volume expansion year-over-year. This growth generated $3,058,109 thousand in total revenue, up 50.3% from the $2,034,261 thousand recognized in FY 2024.
Despite substantial top-line acceleration, Polestar faced significant headwinds resulting in an operating loss of $2,009,257 thousand and a net loss of $2,357,231 thousand for FY 2025. These results were heavily impacted by asset impairment charges totaling $1,049,851 thousand, rising geopolitical tariffs, and organizational restructuring expenses. In response, executive leadership has undertaken comprehensive cost-reduction programs, reducing organizational headcount by nearly 40% to streamline operating expenditure and realign unit economics.
┌─────────────────────────────────────────────────────────────────────────┐
│                      POLESTAR OPERATIONAL ARCHITECTURE                  │
├─────────────────────────┬─────────────────────────┬─────────────────────┤
│  Strategic Foundation   │   Asset-Light Scale     │  Commercial Reach   │
├─────────────────────────┼─────────────────────────┼─────────────────────┤
│ • Pure-play BEV focus   │ • Contract production   │ • 28 Active markets │
│ • Volvo & Geely backing │   via Volvo & Geely     │ • 211 Sales points  │
│ • In-house R&D in SE    │ • Tooling monetization  │ • 1,243 Volvo-linked│
│ • Climate target 2040   │ • Tariffs mitigation    │   service centers   │
└─────────────────────────┴─────────────────────────┴─────────────────────┘
Business Segments
Polestar manages its business operations through an integrated automotive business structure. The company generates commercial revenue through six primary distinct revenue streams, categorized under vehicle sales, carbon credit monetizations, intellectual property licensing, vehicle leasing, performance software sales, and secondary parts distribution.
                  FY 2025 REVENUE BREAKDOWN BY STREAM
  ┌──────────────────────────────────────────────────────────┬───────────┐
  │ Revenue Category                                         │  Share %  │
  ├──────────────────────────────────────────────────────────┼───────────┤
  │ Vehicle Sales                                            │   91.74%  │
  │ Carbon Credits                                           │    6.29%  │
  │ Vehicle Leasing                                          │    0.56%  │
  │ Licenses and Royalties                                   │    0.39%  │
  │ Software & Performance Engineered Kits                   │    0.33%  │
  │ Other Revenue (Parts & Accessories)                      │    0.17%  │
  └──────────────────────────────────────────────────────────┴───────────┘
Revenue Contribution by Commercial Activity
The table below provides a forensic breakdown of Polestar’s revenue streams across FY 2025 and FY 2024, including the exact revenue contribution percentage calculated for each operational stream.
| Revenue Stream | FY 2025 Revenue ($000) | % of Total Revenue (FY 2025) | FY 2024 Revenue ($000) | % of Total Revenue (FY 2024) | Period Variance ($) | Period Variance (%) |
| Sales of Vehicles | $2,805,635 | 91.74% (Calculated by FirmsWorld) | $1,975,864 | 97.13% (Calculated by FirmsWorld) | +$829,771 | +42.0% |
| Sales of Carbon Credits | $192,386 | 6.29% (Calculated by FirmsWorld) | $10,918 | 0.54% (Calculated by FirmsWorld) | +$181,468 | +1,662.0% |
| Vehicle Leasing Revenue | $17,175 | 0.56% (Calculated by FirmsWorld) | $12,396 | 0.61% (Calculated by FirmsWorld) | +$4,779 | +38.6% (Calculated by FirmsWorld) |
| Sales of Licenses & Royalties | $11,851 | 0.39% (Calculated by FirmsWorld) | $32,374 | 1.59% (Calculated by FirmsWorld) | -$20,523 | -63.4% (Calculated by FirmsWorld) |
| Sales of Software & Performance Kits | $10,055 | 0.33% (Calculated by FirmsWorld) | $15,344 | 0.75% (Calculated by FirmsWorld) | -$5,289 | -34.5% (Calculated by FirmsWorld) |
| Other Revenue | $5,263 | 0.17% (Calculated by FirmsWorld) | $3,109 | 0.15% (Calculated by FirmsWorld) | +$2,154 | +69.3% (Calculated by FirmsWorld) |
| Total Consolidated Net Revenue | $3,058,109 | 100.00% | $2,034,261 | 100.00% | +$1,023,848 | +50.3% |
Source: Polestar Automotive Holding UK PLC Annual Report and Financial Statements for the year ended 31 December 2025. Percentages and select variance rates calculated by FirmsWorld.
Detailed Operational Profiles by Revenue Stream
1. Sales of Vehicles (Commercial Automotive Operations)
Vehicle sales represent the primary commercial driver of the Group, delivering $2,805,635 thousand in FY 2025 (91.74% of total revenue), an expansion of 42.0% compared to $1,975,864 thousand in FY 2024. Commercial vehicle revenue is generated through retail sales to individual end consumers, commercial enterprise fleet operators, institutional leasing partners, and independent importer networks.
Revenue recognition occurs at a point in time when physical control of the vehicle transfers to the buyer upon handover. Contracts typically incorporate bundled performance obligations, including over-the-air software updates, connected services, roadside assistance, and scheduled maintenance, which are unbundled and recognized over straight-line service periods (typically up to 8 years). The top-line growth of $829,771 thousand was achieved through a combination of higher total handover volumes ($559.2 million volume impact) and favorable carline mix realizations ($270.5 million price/mix impact).
2. Sales of Regulatory Carbon Credits (Environmental Attribute Monetization)
Polestar monetizes its zero-tailpipe-emission status by selling surplus automotive environmental regulatory credits to legacy OEMs requiring compliance offsets. In FY 2025, carbon credit sales yielded $192,386 thousand (6.29% of total revenue), an increase of 1,662.0% over the $10,918 thousand recognized in FY 2024.
- European Union Pooling Mechanism: The 2025 surge was primarily driven by participation in an EU Fleet Emissions Pooling agreement, whereby Polestar pools its zero-emission fleet with high-emission automotive manufacturers to lower aggregate regulatory penalties. Revenue under pooling arrangements is recognized over time based on vehicle registration outputs across eligible member states.
- Bilateral Credit Transfers: Direct credit sales are recognized at a point in time when regulatory agencies confirm the permanent transfer of credit balances to the purchasing OEM’s registry account.
3. Vehicle Leasing Revenue (Buy-Back Operating Lease Structures)
Vehicle leasing revenue accounted for $17,175 thousand in FY 2025 (0.56% of total revenue), compared to $12,396 thousand in FY 2024. This stream originates from commercial contracts where Polestar sells vehicles alongside guaranteed repurchase obligations (buy-back agreements) at fixed forward dates and predetermined residual values.
In accordance with IFRS accounting policies, transactions carrying repurchase obligations are accounted for as operating leases rather than direct outright sales. The financial difference between the initial gross selling price and the contractually agreed repurchase amount is deferred and recognized straight-line over the operational lease term.
4. Sales of Licenses and Royalties (IP Monetization)
Intellectual property licensing generated $11,851 thousand in FY 2025 (0.39% of total revenue), declining from $32,374 thousand in FY 2024. This business activity monetizes Polestar’s proprietary technology, design assets, and vehicle architectures through contractual arrangements with strategic partners, including Volvo Cars.
Under these frameworks, Polestar licenses intellectual property and trademarks that allow partner entities to manufacture, market, and distribute specific automotive components, replacement parts, and accessories. Revenue is accounted for as sales-based royalties under IFRS 15, recognized at the point in time when partner sales occur.
5. Sales of Software and Performance Engineered Kits
Performance optimization kits and software upgrades generated $10,055 thousand in FY 2025 (0.33% of total revenue), down 34.5% compared to $15,344 thousand in FY 2024. This revenue stream reflects historical licensing agreements granting Volvo Cars the right to market engine calibrations, performance-enhancing software packages, and performance kits to Volvo car buyers.
The decline reflects Polestar’s strategic prioritization of its own branded, dedicated BEV line-up over legacy third-party performance kit distribution. Performance software revenue is recognized upon the initial transfer of software know-how and associated digital delivery.
6. Other Revenue (Components & Aftermarket Accessories)
Other miscellaneous commercial revenue contributed $5,263 thousand in FY 2025 (0.17% of total revenue), representing a 69.3% increase over the $3,109 thousand recorded in FY 2024. This line item encompasses direct sales of specialized vehicle accessories, merchandise, and replacement components sold directly through Polestar retail networks and digital customer applications.
History and Evolution
Polestar originated from a Scandinavian racing and performance engineering heritage, subsequently transforming into an independent, pure-play electric vehicle manufacturer.
  2017: Founded as dedicated premium EV manufacturer by Volvo Cars & Geely Group
   │
  2020: Launch of volume commercial operations with Polestar 2 fastback
   │
  2022: NASDAQ Public Listing via business combination with Gores Guggenheim (GGI)
   │
  2024: Leadership Transition (New CEO/CFO appointed); Commercial shift to Agency Model
   │
  2025: Product Expansion (Polestar 3 & 4 full rollout; Polestar 5 GT unveiled)
   │
  2026+: Largest Ever Model Offensive (Polestar 5 deliveries; Polestar 4 SUV; Polestar 2 successor; Polestar 7)
In 2017, Volvo Cars and Zhejiang Geely Holding Group formally established Polestar as an independent electric performance brand, headquartering engineering and executive management in Gothenburg, Sweden. The new enterprise was established with an asset-light corporate structure designed to circumvent the heavy capital expenditure associated with legacy manufacturing facilities by utilizing the production lines and purchasing scale of Volvo Cars and Geely.
The initial product strategy introduced the low-volume Polestar 1 performance hybrid halo coupe, followed in 2020 by the global commercial rollout of the all-electric Polestar 2 fastback sedan. Manufactured in Taizhou, China, the Polestar 2 established the brand’s global identity, ultimately accumulating more than 190,000 lifetime vehicle deliveries across global markets.
On June 23, 2022, Polestar achieved a major milestone by executing a capital reorganization and business combination with Gores Guggenheim, Inc. (GGI), listing its American Depositary Shares on the NASDAQ stock exchange on June 24, 2022. This transaction provided capital to fund model development, retail expansion, and global brand rollout.
In October 2024, Polestar executed a comprehensive executive leadership transition, appointing Michael Lohscheller as Chief Executive Officer and Jean-François Mady as Chief Financial Officer. Under new management, the company initiated a restructuring program to lower fixed costs, streamline headcount, and transition its distribution strategy away from a purely direct-to-consumer digital channel toward an active selling “non-genuine agency model”.
During FY 2025, Polestar began global customer handovers of its luxury SUVs—the Polestar 3 and Polestar 4—and officially presented the Polestar 5 four-door GT. In December 2025, Polestar executed an ADS ratio consolidation, altering its ratio from 1 ADS per 1 ordinary share to 1 ADS per 30 ordinary shares. Entering 2026, the company announced the largest product offensive in its history, scheduling four new model launches and variants across a three-year horizon.
Products and Services
Polestar’s portfolio is built around performance-oriented battery electric vehicles, integrated charging software infrastructure, and smart energy home solutions.
┌─────────────────────────────────────────────────────────────────────────┐
│                       POLESTAR PRODUCT LINEUP                           │
├───────────────────┬───────────────────┬────────────────┬────────────────┤
│ Polestar 2        │ Polestar 3        │ Polestar 4     │ Polestar 5     │
│ Fastback Sedan    │ Luxury E-SUV      │ SUV Coupé      │ 4-Door GT Halo │
│ Taizhou, China    │ USA & China       │ China & S.Korea│ Wuhan, China   │
└───────────────────┴───────────────────┴────────────────┴────────────────┘
Automotive Product Portfolio
1. Polestar 4 (Electric Performance SUV Coupé)
The Polestar 4 transitioned into the company’s primary global sales volume driver during FY 2025. Combining the aerodynamics of a performance coupé with the spacious interior volume of an SUV, the vehicle is manufactured at Geely’s Hangzhou Bay plant in China and at the Renault Korea plant in Busan, South Korea.
The dual-plant production architecture provides supply chain flexibility to navigate regional trade tariffs. The model received the Red Dot “Best of the Best” Product Design award in 2025. A new estate/SUV body variant of the Polestar 4 is scheduled for commercial introduction in the fourth quarter of 2026.
2. Polestar 2 (Electric Performance Fastback)
The Polestar 2 represents the foundation of the brand’s volume rollout, with cumulative deliveries exceeding 190,000 units. Produced at the Taizhou manufacturing facility in China, the vehicle features dual-motor and single-motor electric powertrains and has won over 50 international design awards. While FY 2025 sales volumes experienced a planned reduction as the product matured, an all-new redesigned successor based on shared group architecture is scheduled to launch in early 2027.
3. Polestar 3 (The SUV for the Electric Age)
The Polestar 3 is a premium, full-size electric performance SUV designed for aerodynamic efficiency and luxury driving dynamics. Manufactured at Volvo Cars’ manufacturing facility in Charleston, South Carolina, USA, and at the Chengdu plant in China, production is being strategically consolidated into Charleston to optimize production efficiencies and insulate North American sales from import tariffs. In 2025, the Polestar 3 secured a Guinness World Record for the longest distance covered by an electric SUV on a single charge and achieved Euro NCAP’s safest Executive Car of 2025 rating.
4. Polestar 5 (Electric 4-Door Grand Tourer)
Unveiled at the IAA mobility exhibition in Munich, the Polestar 5 serves as the brand’s high-performance technological halo vehicle. Built on a bespoke bonded aluminum architecture engineered by Polestar’s specialized R&D team, the vehicle is manufactured at Geely’s Wuhan facility in China, with initial customer handovers commencing in summer 2026.
5. Polestar 6 and Polestar 7 (Future Development Pipeline)
The development pipeline includes the Polestar 6, a luxury electric roadster based on the Polestar 5 bonded aluminum platform. Additionally, the company announced the Polestar 7, a compact premium SUV slated for market launch in 2028, with manufacturing planned directly within Europe to expand volume access in high-growth vehicle segments.
Digital Services and Charging Solutions
- Polestar Charge Network: Provides European EV drivers access to over 1,000,000 public charging stations integrated into a unified mobile application, including Tesla Superchargers and the Ionity network. In North America, vehicles access over 25,000 Tesla Supercharging points via NACS adaptors.
- Polestar Energy (Smart Home Charging): Automated smart charging software that schedules vehicle battery charging during periods of lowest grid demand and highest renewable energy generation, lowering ownership costs and supporting grid stability.
- Bi-Directional Vehicle-to-Home (V2H) Charging: Commercialized in California in partnership with dcbel for Polestar 3 owners, enabling vehicles to export stored battery power back into homes during blackouts or peak tariff windows.
- Connected Car Software & Lifecycle OTA Services: Over-the-air digital capabilities providing performance upgrades, maintenance monitoring, and infotainment functionality across an 8-year estimated lifecycle.
Brand Portfolio
Polestar organizes its intellectual property and market identity under a single, premium brand umbrella characterized by the core brand pillars: Pure, Progressive, Performance.
                 POLESTAR BRAND ECOSYSTEM ARCHITECTURE
  ┌──────────────────────────────────────────────────────────────────┐
  │                 POLESTAR AUTOMOTIVE HOLDING                      │
  ├──────────────────┬───────────────────────┬───────────────────────┤
  │ Vehicle Division │ Charging Infrastructure│ Research Initiatives │
  ├──────────────────┼───────────────────────┼───────────────────────┤
  │ • Polestar 2-5   │ • Polestar Charge     │ • Polestar 0 Project  │
  │ • Polestar 6-7   │ • Polestar Energy     │ • Mission 0 House     │
  └──────────────────┴───────────────────────┴───────────────────────┘
The master brand operates across international markets without regional sub-brands, ensuring consistent positioning in the luxury BEV segment. Primary brand extensions support ecosystem value creation:
- Polestar Charge: The global digital charging aggregator service.
- Polestar Energy: The grid-integrated home energy management platform.
- Polestar Engineered: Performance software packages and vehicle hardware tuning.
- Polestar 0 Project / Mission 0 House: Long-term R&D initiative collaborating with industrial partners to eliminate supply chain emissions and develop a climate-neutral vehicle by 2030 without offsets.
Geographical Presence
Polestar operates a global commercial and industrial footprint spanning 28 active consumer markets across Europe, North America, and Asia-Pacific.
┌─────────────────────────────────────────────────────────────────────────┐
│                       GLOBAL OPERATIONAL FOOTPRINT                      │
├─────────────────────┬─────────────────────┬─────────────────────────────┤
│ Manufacturing Base  │ Commercial Markets  │ Corporate Infrastructure    │
├─────────────────────┼─────────────────────┼─────────────────────────────┤
│ • China (4 Plants)  │ • Europe (~80% sales│ • HQ: Gothenburg, Sweden    │
│ • USA (Charleston)  │ • North America     │ • Reg. Office: Bristol, UK  │
│ • South Korea (Busan│ • Asia Pacific      │ • 211 Retail Sales Points   │
│ • Europe (From 2028)│ • 28 Active Markets │ • 1,243 Service Points      │
└─────────────────────┴─────────────────────┴─────────────────────────────┘
Commercial Market Dynamics
Polestar’s sales distribution is heavily weighted toward Europe, which accounts for close to 80% of total retail vehicle delivery volume. During FY 2025, commercial operations expanded into new geographic territories, including a launch in France in June 2025.
The physical retail footprint expanded from 175 sales points at the end of 2024 to 211 active retail spaces globally by year-end 2025. Outside mainland China, the dedicated retail space network increased from 140 to 211 locations, reflecting a 50.7% expansion. Customer aftersales and maintenance are supported by 1,243 certified Volvo Cars service partner locations worldwide.
Global Manufacturing and Operational Footprint
Polestar utilizes contract manufacturing agreements with Volvo Cars, Geely Group, and Renault Korea, spreading production across multiple continents to mitigate trade barriers and optimize logistics costs:
| Facility / Location | Operating Entity | Associated Vehicle Lines | Strategic Focus & Status |
| Taizhou Plant, China | Volvo Cars | Polestar 2 | Active volume production facility. |
| Charleston Plant, South Carolina, USA | Volvo Cars | Polestar 3 | North American hub; future consolidated site for Polestar 3. |
| Chengdu Plant, China | Volvo Cars | Polestar 3 | Active production; volume being consolidated to Charleston. |
| Hangzhou Bay Plant, China | Geely Group | Polestar 4 | Active global production hub for Polestar 4 SUV coupé. |
| Busan Plant, South Korea | Renault Korea Co Ltd (35% Geely owned) | Polestar 4 | Production site mitigating North American and European tariff exposures. |
| Wuhan Plant, China | Geely Group | Polestar 5 | Specialized production site for bonded aluminum GT vehicles. |
| Chongqing Plant, China | Geely Group | Powertrain Component Assembly | Operational control transferred to Geely in 2025. |
| European Facility (Location TBA) | Partner Network | Polestar 7 | Planned facility scheduled for production start in 2028. |
Source: Polestar Automotive Holding UK PLC Annual Report and Financial Statements for the year ended 31 December 2025.
Geographical Use-Phase Carbon Distribution
While direct revenue allocation by country is not separately presented in the report, regional vehicle deployment is reflected in the Group’s reported use-phase greenhouse gas emissions:
| Geographic Region | FY 2025 Use-Phase Emissions (tCO2e) | FY 2024 Use-Phase Emissions (tCO2e) | FY 2023 Use-Phase Emissions (tCO2e) | Period-on-Period Variance (%) |
| EMEA (Europe, Middle East, Africa) | 202,775 | 149,010 | 257,012 | +36.1% |
| APAC (Asia-Pacific, excluding China) | 98,485 | 51,904 | 89,720 | +89.7% |
| Americas (North & South America) | 60,612 | 87,846 | 105,910 | -31.0% |
| China | 8,921 | 44,867 | 10,783 | -80.1% |
| Total Global Use-Phase Emissions | 370,792 | 333,627 | 463,424 | +11.1% |
Source: Polestar Automotive Holding UK PLC Annual Report and Financial Statements for the year ended 31 December 2025.
Profit and Loss Analysis
Polestar’s Statement of Loss reflects commercial scaling alongside the financial impact of asset impairments, tariff duties, and restructuring programs.
                  FINANCIAL PERFORMANCE EVOLUTION
  ┌────────────────────────────────────────────────────────────────────────┐
  │ ($ in Millions)            FY 2023         FY 2024         FY 2025     │
  ├────────────────────────────────────────────────────────────────────────┤
  │ Revenue                    $2,368.1        $2,034.3        $3,058.1    │
  │ Gross Loss                 $(410.1)        $(876.2)       $(1,083.9)   │
  │ Impairment Charges         $(339.6)        $(622.1)       $(1,049.9)   │
  │ Operating Loss            $(1,469.5)      $(1,813.3)      $(2,009.3)   │
  │ Net Loss                  $(1,181.9)      $(2,049.9)      $(2,357.2)   │
  │ Adjusted EBITDA           $(1,017.7)      $(1,080.1)        $(783.4)   │
  └────────────────────────────────────────────────────────────────────────┘
Consolidated Statement of Loss
The following table presents the audited Consolidated Statement of Loss for the financial years ended December 31, 2025, 2024, and 2023.
| Financial Statement Metric ($000) | FY 2025 | FY 2024 | FY 2023 | YoY Variance ($) | YoY Variance (%) |
| Revenue | $3,058,109 | $2,034,261 | $2,368,085 | +$1,023,848 | +50.3% |
| Cost of Sales | $(4,142,019) | $(2,910,428) | $(2,778,222) | -$1,231,591 | -42.3% |
| — Of which Impairment Expense, net | $(1,049,851) | $(622,092) | $(339,568) | -$427,759 | -68.8% |
| — Of which Other Cost of Sales | $(3,092,168) | $(2,288,336) | $(2,438,654) | -$803,832 | -35.1% |
| Gross Loss | $(1,083,910) | $(876,167) | $(410,137) | -$207,743 | -23.7% |
| Selling, General & Administrative | $(856,458) | $(890,703) | $(944,177) | +$34,245 | +3.8% |
| Research & Development Expense | $(38,350) | $(77,636) | $(157,280) | +$39,286 | +50.6% (Calculated by FirmsWorld) |
| Other Operating Income | $62,937 | $59,432 | $52,413 | +$3,505 | +5.9% (Calculated by FirmsWorld) |
| Other Operating Expense | $(87,810) | $(23,818) | $(58,323) | -$63,992 | -268.7% |
| Foreign Exchange Gains/(Losses) – Ops | $(43,705) | $37,466 | $44,144 | -$81,171 | -216.7% |
| Operating Loss | $(2,009,257) | $(1,813,311) | $(1,469,514) | -$195,946 | -10.8% |
| Finance Income | $8,996 | $23,879 | $32,329 | -$14,883 | -62.3% |
| Finance Expense | $(385,190) | $(341,182) | $(213,242) | -$44,008 | -12.9% |
| Foreign Exchange Gains/(Losses) – Fin | $50,282 | $(52,603) | $37,236 | +$102,885 | +195.6% |
| Fair Value Changes – Rights & Class C | $23,391 | $129,124 | $465,168 | -$105,733 | -81.9% |
| Share of Losses in Associates | $(49,145) | $(4,970) | $(43,304) | -$44,175 | -888.8% |
| Loss Before Income Taxes | $(2,360,923) | $(2,059,063) | $(1,191,327) | -$301,860 | -14.7% |
| Income Tax Benefit | $3,692 | $9,166 | $9,452 | -$5,474 | -59.7% |
| Net Loss for the Financial Year | $(2,357,231) | $(2,049,897) | $(1,181,875) | -$307,334 | -15.0% |
Source: Polestar Automotive Holding UK PLC Annual Report and Financial Statements for the year ended 31 December 2025. Certain variance percentages calculated by FirmsWorld.
Financial Commentary and Operational Drivers
Total revenue expanded by 50.3% to $3,058.1 million in FY 2025, driven by higher vehicle deliveries, broader commercial adoption of the Polestar 4, full-year contributions from the Polestar 3, and a $181.5 million increase in regulatory carbon credits realized through the EU emissions pooling agreement.
However, gross loss widened to $1,083.9 million from $876.2 million in FY 2024, driven primarily by non-cash asset impairment charges of $1,049.9 million recognized across property, plant, equipment, and capitalized vehicle development projects. Elevated import tariffs imposed on vehicles produced in China and imported into the European Union and North America also increased the cost of sales.
- Operational Cost Control: SG&A expenses declined by $34.2 million (3.8%) to $856.5 million, reflecting fixed-cost savings of $99.6 million from corporate restructuring and marketing spend efficiency, partially offset by $65.4 million in agency selling commissions.
- R&D Capitalization: Direct R&D expenses declined by 50.6% to $38.4 million, due to lower depreciation and the capitalization of development programs.
- Financing Burden: Net finance expense rose to $385.2 million, driven by higher short-term debt levels and rising borrowing costs.
                   RECONCILIATION TO ADJUSTED EBITDA
  ┌────────────────────────────────────────────────────────┬─────────────┐
  │ GAAP Net Loss (FY 2025)                                │ $(2,357.2)M │
  │ (+) Impairment of Assets (Net)                         │  $1,049.9M  │
  │ (+) Net Finance Expense                                │    $376.2M  │
  │ (+) Depreciation & Amortization                        │    $146.9M  │
  │ (+) Restructuring Costs                                │     $67.6M  │
  │ (+) Other Discrete / Valuation Items                   │    $(66.8)M │
  ├────────────────────────────────────────────────────────┼─────────────┤
  │ Non-GAAP Adjusted EBITDA (FY 2025)                     │   $(783.4)M │
  │ YoY Improvement: +$296.7M (+27.5%)                     │             │
  └────────────────────────────────────────────────────────┴─────────────┘
Non-GAAP Financial Measures Reconciliation
Management utilizes non-GAAP Adjusted EBITDA, Adjusted Gross Profit/(Loss), and Free Cash Flow to evaluate underlying core operational performance by stripping out non-cash asset impairments, share warrant fair value remeasurements, and discrete restructuring outlays.
| Non-GAAP Metric Reconciliation ($000) | FY 2025 | FY 2024 | FY 2023 |
| Reported GAAP Net Loss | $(2,357,231) | $(2,049,897) | $(1,181,875) |
| Fair Value Changes – Earn-out Rights & Class C Shares | $(23,391) | $(129,124) | $(465,168) |
| Finance Expense | $385,190 | $341,182 | $213,242 |
| Finance Income | $(8,996) | $(23,879) | $(32,329) |
| Foreign Exchange (Gains)/Losses on Financial Activities, net | $(50,282) | $52,603 | $(37,236) |
| Income Tax Benefit | $(3,692) | $(9,166) | $(9,452) |
| Depreciation and Amortization | $146,932 | $113,849 | $135,360 |
| Impairment Expense, net of reversals | $1,049,851 | $622,092 | $339,568 |
| Losses/(Gains) on Disposals of Investments | $16 | $4,622 | $(5,442) |
| Restructuring Costs | $67,559 | $0 | $0 |
| Unusual Other Operating (Income) / Expense, net | $10,689 | $(2,345) | $25,676 |
| Adjusted EBITDA | $(783,355) | $(1,080,063) | $(1,017,656) |
| Reported GAAP Gross Loss | $(1,083,910) | $(876,167) | $(410,137) |
| (+) Impairment Expense, net of reversals | $1,049,851 | $622,092 | $339,568 |
| (+) Battery Recycling Provision for pre-2025 Cars | $12,105 | $0 | $0 |
| Adjusted Gross Profit / (Loss) | $(21,954) | $(254,075) | $(70,569) |
| Adjusted Gross Margin (%) | (0.7)% | (12.5)% | (3.0)% |
Source: Polestar Automotive Holding UK PLC Annual Report and Financial Statements for the year ended 31 December 2025.
Balance Sheet and Financial Position
Polestar’s balance sheet reflects an asset-light corporate model, carrying significant short-term debt obligations, substantial liquidity reserves, and a negative net equity position resulting from cumulative historical development losses.
                     BALANCE SHEET STRUCTURE (FY 2025)
  ┌─────────────────────────────────┬──────────────────────────────────┐
  │ ASSETS: $3,929.8M               │ LIABILITIES & EQUITY             │
  ├─────────────────────────────────┼──────────────────────────────────┤
  │ Cash & Equivalents:    $1,159.3M│ Current Liabilities:    $6,208.3M│
  │ Inventories:             $853.1M│ Non-Current Liabilities:$2,843.8M│
  │ Intangibles & IP:        $700.3M│ Total Liabilities:      $9,052.0M│
  │ Property, Plant, Equip:  $293.0M│ ──────────────────────────────── │
  │ Receivables & Other:     $924.1M│ Total Equity (Deficit): $5,122.2M│
  └─────────────────────────────────┴──────────────────────────────────┘
Consolidated Statement of Financial Position
The following table presents the audited Consolidated Statement of Financial Position as of December 31, 2025 and December 31, 2024.
| Statement of Financial Position ($000) | As of 31 Dec 2025 | As of 31 Dec 2024 | Period Variance ($) |
| Non-Current Assets | |||
| Intangible Assets and Goodwill | $700,326 | $1,040,849 | -$340,523 (Calculated by FirmsWorld) |
| Property, Plant and Equipment | $292,993 | $537,743 | -$244,750 (Calculated by FirmsWorld) |
| Vehicles Under Operating Leases | $100,535 | $56,137 | +$44,398 (Calculated by FirmsWorld) |
| Deferred Tax Assets | $92,345 | $81,554 | +$10,791 (Calculated by FirmsWorld) |
| Other Non-Current Assets | $54,943 | $39,740 | +$15,203 (Calculated by FirmsWorld) |
| Total Non-Current Assets | $1,241,142 | $1,756,023 | -$514,881 (Calculated by FirmsWorld) |
| Current Assets | |||
| Cash and Cash Equivalents | $1,159,300 | $739,237 | +$420,063 (Calculated by FirmsWorld) |
| Inventories | $853,079 | $1,079,361 | -$226,282 (Calculated by FirmsWorld) |
| Trade Receivables and Other Receivables | $341,881 | $233,088 | +$108,793 (Calculated by FirmsWorld) |
| Other Current Assets | $323,294 | $241,620 | +$81,674 (Calculated by FirmsWorld) |
| Current Tax Assets | $11,119 | $5,021 | +$6,098 (Calculated by FirmsWorld) |
| Total Current Assets | $2,688,673 | $2,298,327 | +$390,346 (Calculated by FirmsWorld) |
| Total Consolidated Assets | $3,929,815 | $4,054,350 | -$124,535 (Calculated by FirmsWorld) |
| Current Liabilities | |||
| Loans and Borrowings (Current) | $(3,860,675) | $(2,657,839) | -$1,202,836 (Calculated by FirmsWorld) |
| Trade Payables | $(1,107,162) | $(893,914) | -$213,248 (Calculated by FirmsWorld) |
| Other Current Liabilities | $(587,037) | $(478,365) | -$108,672 (Calculated by FirmsWorld) |
| Accrued Expenses | $(424,577) | $(519,760) | +$95,183 (Calculated by FirmsWorld) |
| Provisions (Current) | $(120,791) | $(72,769) | -$48,022 (Calculated by FirmsWorld) |
| Lease Liabilities (Current) | $(37,210) | $(30,922) | -$6,288 (Calculated by FirmsWorld) |
| Contract Liabilities (Current) | $(37,183) | $(37,649) | +$466 (Calculated by FirmsWorld) |
| Advance Payments from Customers | $(16,062) | $(17,344) | +$1,282 (Calculated by FirmsWorld) |
| Current Tax Liabilities | $(12,276) | $(28,872) | +$16,596 (Calculated by FirmsWorld) |
| Class C Shares Warrant Liability | $(5,308) | $(3,500) | -$1,808 (Calculated by FirmsWorld) |
| Total Current Liabilities | $(6,208,281) | $(4,740,934) | -$1,467,347 (Calculated by FirmsWorld) |
| Non-Current Liabilities | |||
| Loans and Borrowings (Non-Current) | $(2,499,230) | $(2,281,062) | -$218,168 (Calculated by FirmsWorld) |
| Provisions (Non-Current) | $(133,536) | $(94,757) | -$38,779 (Calculated by FirmsWorld) |
| Lease Liabilities (Non-Current) | $(104,349) | $(93,514) | -$10,835 (Calculated by FirmsWorld) |
| Contract Liabilities (Non-Current) | $(76,091) | $(61,002) | -$15,089 (Calculated by FirmsWorld) |
| Other Non-Current Liabilities | $(71,398) | $(37,228) | -$34,170 (Calculated by FirmsWorld) |
| Earn-Out Rights Liability | $(28,778) | $(3,579) | -$25,199 (Calculated by FirmsWorld) |
| Deferred Tax Liabilities | $(577) | $(630) | +$53 (Calculated by FirmsWorld) |
| Total Non-Current Liabilities | $(2,843,755) | $(2,641,976) | -$201,779 (Calculated by FirmsWorld) |
| Total Consolidated Liabilities | $(9,052,036) | $(7,382,910) | -$1,669,126 (Calculated by FirmsWorld) |
| Equity | |||
| Share Capital | $(27,817) | $(21,169) | -$6,648 (Calculated by FirmsWorld) |
| Other Contributed Capital | $(4,133,458) | $(3,625,027) | -$508,431 (Calculated by FirmsWorld) |
| Foreign Currency Translation Reserve | $63,152 | $14,661 | +$48,491 (Calculated by FirmsWorld) |
| Accumulated Deficit | $9,268,835 | $6,911,604 | +$2,357,231 (Calculated by FirmsWorld) |
| Total Equity (Deficit Balance) | $5,122,221 | $3,328,560 | +$1,793,661 (Calculated by FirmsWorld) |
Source: Polestar Automotive Holding UK PLC Annual Report and Financial Statements for the year ended 31 December 2025. Variances calculated by FirmsWorld.
Financial Health and Capital Structure Analysis
Polestar closed FY 2025 with total liquidity of $1,159.3 million in cash and cash equivalents, supported by $751.2 million in uncommitted available credit facilities, up from $739.2 million at year-end 2024.
However, current liabilities of $6,208.3 million exceeded current assets of $2,688.7 million, leaving the Group with net current liabilities (working capital deficit) of $3,519.6 million. Total debt from credit institutions and related-party term facilities reached $6,359.9 million (with $3,860.7 million maturing within 12 months).
- Related-Party Term Debt: Fully drawn bilateral facilities include $1,000.0 million with Volvo Cars (maturing December 2028 at SOFR + 4.97%), $250.0 million with Geely (maturing June 2027 at SOFR + 4.97%), and $300.0 million with Geely (maturing June 2026 at SOFR + 3.00%). In 2025, Polestar secured an additional subordinated loan facility of up to $600.0 million from Geely Sweden Holdings AB.
- Syndicated Club Loan: €340.0 million and $583.5 million green term facility maturing February 2027, subject to minimum cash covenants of €400.0 million and modified debt-to-asset covenants.
- Currency Reserves: Cash balances are held across multiple operational currencies, including SEK 932.6 million, USD 67.2 million, EUR 58.1 million, GBP 39.7 million, and CNY 18.1 million.
Cash Flow Dynamics
Polestar’s cash flow reflects ongoing commercial expansion and vehicle development demands, financed through external capital raises and related-party credit arrangements.
                     FY 2025 CASH FLOW WATERFALL
  ┌────────────────────────────────────────────────────────┬─────────────┐
  │ Cash & Cash Equivalents (Beginning of Year)             │   $739.2M   │
  │ Net Cash Used in Operating Activities                  │  $(915.0)M  │
  │ Net Cash Used in Investing Activities                  │  $(520.7)M  │
  │ Net Cash Provided by Financing Activities              │ $1,693.1M   │
  │ Net Foreign Exchange Translation Effect                │   $162.6M   │
  ├────────────────────────────────────────────────────────┼─────────────┤
  │ Cash & Cash Equivalents (End of Year 2025)             │ $1,159.3M   │
  │ Net Annual Liquidity Expansion: +$420.1M               │             │
  └────────────────────────────────────────────────────────┴─────────────┘
Consolidated Statement of Cash Flows
The following table presents the audited Consolidated Statement of Cash Flows for FY 2025, FY 2024, and FY 2023.
| Cash Flow Statement Item ($000) | FY 2025 | FY 2024 | FY 2023 |
| Operating Activities | |||
| Net Loss for the Financial Year | $(2,357,231) | $(2,049,897) | $(1,181,875) |
| Depreciation and Amortization | $52,724 | $55,719 | $115,445 |
| Impairment of PPE, Lease Vehicles, and Intangibles | $1,049,851 | $622,092 | $339,568 |
| Impairment of Inventory (NRV Write-Downs) | $155,958 | $89,744 | $146,550 |
| Net Finance Expense | $376,194 (Calculated) | $317,303 (Calculated) | $180,913 (Calculated) |
| Changes in Inventories | $292,229 | $(255,370) | $(358,392) |
| Changes in Working Capital Assets & Liabilities | $(304,257) | $508,047 (Calculated) | $(567,738) (Calculated) |
| Net Interest and Taxes Paid | $(349,080) (Calculated) | $(234,504) (Calculated) | $(268,653) (Calculated) |
| Other Non-Cash Adjustments | $(180,477) (Calculated) | $(464,343) (Calculated) | $(480,572) (Calculated) |
| Net Cash Used in Operating Activities | $(914,989) | $(991,209) | $(1,893,841) |
| Investing Activities | |||
| Additions to Intangible Assets | $(296,079) | $(435,584) | $(209,101) |
| Additions to Property, Plant, and Equipment | $(158,713) | $(137,400) | $(147,894) |
| Investments in Associates (Polestar Times Tech) | $(63,700) | $(34,300) | $0 |
| Other Investing Activities & Asset Disposals | $(2,186) (Calculated) | $194,722 (Calculated) | $139,376 (Calculated) |
| Net Cash Used in Investing Activities | $(520,678) | $(412,562) | $(417,619) |
| Financing Activities | |||
| Proceeds from Short-Term Loans & Borrowings | $4,154,620 | $3,411,263 | $3,273,888 |
| Proceeds from Long-Term Loans & Borrowings | $191,322 | $938,474 | $1,381,738 |
| Repayments of Loans and Borrowings | $(3,117,438) | $(2,553,008) | $(2,889,899) |
| Proceeds from Equity Issuance (PIPE Deals) | $498,343 | $0 | $0 |
| Repayments of Lease Liabilities | $(33,752) | $(35,646) | $(21,916) |
| Other Financing Activities & Capital Contributions | $0 | $63,109 (Calculated) | $360,550 (Calculated) |
| Net Cash Provided by Financing Activities | $1,693,095 | $1,424,192 | $2,104,361 |
| Effect of Foreign Exchange Rate Movements | $162,635 | $(49,448) | $1,486 |
| Net Increase / (Decrease) in Cash & Cash Equivalents | $420,063 | $(29,027) | $(205,613) |
| Cash and Cash Equivalents at Beginning of Year | $739,237 | $768,264 | $973,877 |
| Cash and Cash Equivalents at End of Year | $1,159,300 | $739,237 | $768,264 |
Source: Polestar Automotive Holding UK PLC Annual Report and Financial Statements for the year ended 31 December 2025. Certain sub-totals calculated by FirmsWorld.
Free Cash Flow Analysis
Operating cash burn improved to $(915.0) million in FY 2025, compared to $(991.2) million in FY 2024 and $(1,893.8) million in FY 2023, aided by a $292.2 million positive working capital unwind from inventory reduction. Capital expenditure commitments for property, plant, and equipment ($(158.7) million) and capitalized software/intangible tooling ($(296.1) million) resulted in total capital additions of $(454.8) million. Consequently, non-GAAP Free Cash Flow stood at $(1,369.8) million in FY 2025, compared to $(1,348.2) million in FY 2024 and $(2,466.8) million in FY 2023.
Board of Directors and Leadership Team
Polestar is governed by a unitary Board of Directors supported by specialized committees: the Audit Committee, the Compensation Committee, and the Nominating and Governance Committee.
┌─────────────────────────────────────────────────────────────────────────┐
│                       POLESTAR BOARD OF DIRECTORS                       │
├────────────────────────┬───────────────────────┬────────────────────────┤
│ Leadership             │ Independent Directors │ Shareholder Nominees   │
├────────────────────────┼───────────────────────┼────────────────────────┤
│ • Winfried Vahland     │ • Christine Gorjanc   │ • Francesca Gamboni    │
│   (Chair of the Board) │ • Cynthia Dubin       │   (Volvo Cars CIRO)    │
│ • Michael Lohscheller  │ • Karl-Thomas Neumann │ • Quan (Joe) Zhang     │
│   (Executive Dir / CEO)│ • Laura Shen          │   (Geely Group CFO)    │
└────────────────────────┴───────────────────────┴────────────────────────┘
Board Composition and Committee Allocations
The table below outlines the composition of Polestar’s Board of Directors as of year-end 2025, detailing committee memberships and tenure.
| Director Name | Role & Independence Status | Date Appointed / Tenure | Audit Committee | Compensation Committee | Nominating & Governance |
| Prof. Dr. h.c. Winfried Vahland | Board Chair (Independent Non-Executive) | 15 Jan 2024 (Chair from Oct 2024) | — | — | Member |
| Michael Lohscheller | Chief Executive Officer (Executive Director) | 1 Oct 2024 | — | — | — |
| Cynthia Dubin | Independent Non-Executive Director | 30 June 2025 | Member | Chair | — |
| Christine Gorjanc | Independent Non-Executive Director | 7 Oct 2024 | Chair | Member | — |
| Dr. Karl-Thomas Neumann | Independent Non-Executive Director | 23 June 2022 | — | — | Chair |
| Prof. Xiaojie (Laura) Shen | Independent Non-Executive Director | 7 Oct 2024 | Member | — | — |
| Francesca Gamboni | Non-Executive Director (Volvo Nominee) | 7 Oct 2024 | — | — | — |
| Quan (Joe) Zhang | Non-Executive Director (Geely Nominee) | 30 June 2025 | — | Member | Member |
Source: Polestar Automotive Holding UK PLC Annual Report and Financial Statements for the year ended 31 December 2025.
Comprehensive Biographies of Directors and Officers
Prof. Dr. h.c. Winfried Vahland (Board Chair & Independent Non-Executive Director)
Prof. Dr. h.c. Winfried Vahland brings 40 years of international automotive industry experience. He began his career at Adam Opel AG in 1984 and spent 25 years in executive positions within the Volkswagen Group, serving as CEO of Skoda from 2010 to 2015. He previously served on the Volvo Cars Board from 2019 to 2024 and currently serves as Honorary Chairman of the Supervisory Board of EuroCar AG and as a Member of the Supervisory Board of Proton Holdings Berhad. He holds a Master’s Degree in Mechanical Engineering and Business Administration from TU Darmstadt and an MBA from GMI Engineering & Management Institute, Michigan.
Michael Lohscheller (Chief Executive Officer & Executive Director)
Michael Lohscheller was appointed CEO and Executive Director in October 2024. Prior to joining Polestar, he served as President and CEO of Nikola Corporation (2022–2023), Global CEO of VinFast (2021), and CEO of Opel Automobile at Stellantis (2017–2021). His career spans over 20 years in senior leadership across DaimlerChrysler, Volkswagen Group, and Stellantis. He holds an MA in Marketing Management from Brunel University London and a BA in Business Administration from Osnabrück University of Applied Sciences.
Cynthia Dubin (Independent Non-Executive Director & Compensation Chair)
Cynthia Dubin has over 30 years of executive experience across the energy, industrial, and financial sectors. She serves as an independent director and Audit Committee member at Hurco Companies, Inc., and Chair of the Risk and Audit Committee at ICE Futures Europe. She previously served on the board of the U.K. Competition and Markets Authority (2019–2025), Synthomer PLC, and Babcock & Wilcox Enterprises. She holds a BSBA in Finance and Economics from Georgetown University.
Christine Gorjanc (Independent Non-Executive Director & Audit Committee Chair)
Christine Gorjanc is a certified corporate director and former high-growth technology CFO. She serves on the board and as Audit Committee Chair of Forward Air, having previously served on the boards of Juniper Networks, Invitae, and Shapeways Holdings. She was Chief Financial Officer of Arlo Technologies (2018–2020) and CFO of NETGEAR (2008–2018). She holds a BBA in Accounting from the University of Texas at El Paso and an MS in Taxation from Golden Gate University.
Dr. Karl-Thomas Neumann (Independent Non-Executive Director & NomGov Chair)
Dr. Karl-Thomas Neumann is the founder and CEO of KTN Investment and Consulting. His career includes serving as Executive Vice President of General Motors and President of GM Europe (2013–2018), CEO and Vice President of Volkswagen Group China (2010–2012), and Chairman of the Executive Board of Continental AG (2008–2009). He sits on the boards of indie Semiconductor, Hyundai-Mobis, and SK-On. He holds a Ph.D. in Microelectronics from the University of Duisburg.
Prof. Xiaojie (Laura) Shen (Independent Non-Executive Director)
Prof. Laura Shen has 30 years of automotive leadership experience in China. She spent over 15 years in executive roles at Volkswagen Group China, including Managing Director of Volkswagen Group Import and Head of Sales & Service Operations. She also previously led sales operations at Jiangling Motors and BMW Brilliance. She holds an MBA from SUNY Buffalo and a Postgraduate Diploma from NTU Singapore.
Francesca Gamboni (Non-Executive Director – Volvo Cars Representative)
Francesca Gamboni has close to 30 years of supply chain and industrial operations expertise. She currently serves as Chief Industrial Operations Officer at Volvo Cars. Prior executive roles include Chief Supply Chain and Manufacturing Officer at Accell Group, Senior VP of Global Supply Chain at Stellantis, and VP of Supply Chain at Renault. She holds an MS in Industrial Technology Engineering from Politecnico di Milano.
Quan (Joe) Zhang (Non-Executive Director – Geely Representative)
Quan Zhang is Vice President and Chief Financial Officer of Zhejiang Geely Holding Group. He joined Geely in 2014 and has held positions including Deputy CFO and General Manager of Financial Management. He serves as Chairman of Lotus Group International and Genius Auto Finance, and holds directorships at CaoCao Inc. and Zhejiang Farizon New Energy Commercial Vehicle Group. He holds a bachelor’s degree in international accounting from Shanghai University of Finance and Economics.
- Departed Directors in 2025: Karen C. Francis (resigned June 30, 2025), Donghui (Daniel) Li (resigned June 30, 2025), David Richter (resigned June 30, 2025), Zhe (David) Wei (resigned June 30, 2025).
- Key Executive Officers: Michael Lohscheller (CEO), Jean-François Mady (CFO), Jonas Engström (Head of Strategy/Operations), Nina Henricsson (CHRO).
Subsidiaries, Associates, and Joint Ventures
Polestar operates as a holding structure with operational and R&D activities conducted through global operating subsidiaries and regional corporate partnerships.
                 POLESTAR GROUP CORPORATE STRUCTURE
  ┌──────────────────────────────────────────────────────────────────┐
  │              POLESTAR AUTOMOTIVE HOLDING UK PLC                  │
  │                  (UK Parent Holding Entity)                      │
  └────────────────────────────────┬─────────────────────────────────┘
                                   │
       ┌───────────────────────────┴───────────────────────────┐
       ▼                                                       ▼
┌─────────────────────────────────┐           ┌────────────────────────────────┐
│     Polestar Performance AB     │           │   Polestar Times Technology    │
│  (100% Owned Swedish Operating  │           │   (46.2% Associate Venture)    │
│            Entity)              │           │ • Equity-accounted in China    │
│ • Holds IP, R&D & Core Ops      │           │ • Software / In-car Tech Dev   │
└─────────────────────────────────┘           └────────────────────────────────┘
Entity Holdings and Accounting Relationships
| Entity Name | Jurisdiction | Direct / Effective Ownership (%) | Nature of Entity & Role | Financial Statement Impact (FY 2025) |
| Polestar Performance AB | Sweden | 100.0% (Direct Subsidiary) | Primary global operating subsidiary; holds intellectual property, R&D assets, and commercial contracts. | Consolidated fully in Group financial statements. |
| Polestar Times Technology | China | 46.2% (Associate Investment) | Joint venture with Xingji Meizu developing localized digital in-car operating software for China. | $(49,145) thousand share of associate losses recognized in FY 2025. |
| Polestar UK | United Kingdom | 100.0% (Subsidiary Group) | UK sales and commercial distribution arm. | Consolidated fully; represents UK market sales. |
Source: Polestar Automotive Holding UK PLC Annual Report and Financial Statements for the year ended 31 December 2025.
Other Investments and Minority Holdings
Polestar holds strategic minority equity interests to develop regional software architectures and secure supplier partnerships.
Polestar Times Technology Joint Venture
During 2023 and 2024, Polestar established a joint software venture, Polestar Times Technology, alongside mobile technology firm Xingji Meizu. Following additional equity funding from the Nanjing Jiangning Economic and Technological Development Zone Industrial Equity Investment Partnership in 2024, Polestar’s equity stake was reduced from 49.0% to 46.2%.
- Carrying Value Status: In FY 2024, Polestar’s carrying value in Polestar Times Technology was written down to zero due to cumulative operating losses.
- FY 2025 Capital Calls: During FY 2025, Polestar injected $63,700 thousand in fresh capital contributions into the associate, triggering the recognition of $49,145 thousand in previously unrecognized associate losses in the Consolidated Statement of Loss.
Physical Properties and Infrastructure Footprint
Polestar utilizes a lean corporate footprint, focusing capital investment on vehicle design and tooling while contracting factory manufacturing to Volvo Cars, Geely Group, and Renault Korea.
┌─────────────────────────────────────────────────────────────────────────┐
│                      FACILITIES & INFRASTRUCTURE                        │
├─────────────────────┬─────────────────────┬─────────────────────────────┤
│ Corporate & Tech    │ Manufacturing Plants│ Commercial Distribution     │
├─────────────────────┼─────────────────────┼─────────────────────────────┤
│ • Gothenburg HQ (SE)│ • Taizhou (CN) - PS2│ • 211 Sales Points          │
│ • Bristol Office(UK)│ • Charleston(US)-PS3│ • 1,243 Service Points      │
│ • Design & R&D Hubs │ • Hangzhou(CN) - PS4│ • Global logistics hubs     │
│                     │ • Busan(KR) - PS4   │ • Test drive / retail spaces│
│                     │ • Wuhan(CN) - PS5   │                             │
└─────────────────────┴─────────────────────┴─────────────────────────────┘
- Global Management Headquarters: Assar Gabrielssons väg 9, 418 78 Göteborg, Sweden (Primary R&D, corporate governance, and design studio center).
- Registered Corporate Office: The Pavilions, Bridgwater Road, Bristol, BS13 8AE, England (Statutory UK registered office).
- Production Tooling Footprint: Proprietary tooling and robotic assembly systems deployed across partner assembly plants in Taizhou (China), Charleston (USA), Chengdu (China), Hangzhou Bay (China), Busan (South Korea), and Wuhan (China).
- Commercial Retail Network: 211 retail Spaces and test-drive activations located across urban centers in 28 countries.
- Certified Aftersales Infrastructure: 1,243 customer service locations accessed through the Volvo Cars global workshop network.
Founders and Corporate Heritage
Polestar was founded as a standalone premium electric performance car brand in 2017 by Volvo Car Corporation and its parent company Zhejiang Geely Holding Group.
  ┌───────────────────────────────────────────────────────────────────────┐
  │                      POLESTAR FOUNDING HERITAGE                       │
  ├───────────────────────────────────┬───────────────────────────────────┤
  │       Volvo Car Corporation       │   Zhejiang Geely Holding Group    │
  ├───────────────────────────────────┼───────────────────────────────────┤
  │ • Safety & platform architectures │ • Scale manufacturing access      │
  │ • Global service network (1,243)  │ • Industrial capacity in Asia     │
  │ • Shared R&D & testing pipelines  │ • Capital & financial backing     │
  └───────────────────────────────────┴───────────────────────────────────┘
The founders structured Polestar to leverage established automotive infrastructure:
- Volvo Cars Industrial Contribution: Contributed engineering know-how, vehicle platform architectures (CMA, SPA2), global homologation expertise, and worldwide aftersales support via 1,243 service locations.
- Geely Group Industrial Contribution: Provided industrial production scale, supply chain purchasing power, shared platform architectures (SEA), and modern manufacturing plants across China and South Korea.
Parent Company Structure
Polestar Automotive Holding UK PLC serves as the ultimate parent holding company of the Polestar Group. The entity’s primary asset consists of equity investments in its operating subsidiaries, principally Polestar Performance AB in Sweden.
- Statutory Framework: Incorporated in England and Wales under Company Number 13624182, preparing its parent financial statements under UK GAAP (FRS 101 Reduced Disclosure Framework).
- Ultimate Controlling Shareholder Group: Zhejiang Geely Holding Group (controlled by founder and chairman Li Shufu) maintains majority beneficial voting control through various affiliate investment entities, including Geely Sweden Holdings AB, PSD Investment Limited, and Snita Holding B.V..
Investments and Capital Expenditure Plans
Polestar manages capital allocation to maintain R&D execution while reducing fixed capital requirements.
                FY 2025 CAPITAL ALLOCATION BREAKDOWN
  ┌────────────────────────────────────────────────────────┬─────────────┐
  │ Capital Expenditure Area                               │   Amount    │
  ├────────────────────────────────────────────────────────┼─────────────┤
  │ Additions to Intangible Assets (Vehicle Software & IP) │   $296.1M   │
  │ Additions to Property, Plant, and Equipment (Tooling)  │   $158.7M   │
  │ Strategic Investments in Tech Associates (Polestar TT) │    $63.7M   │
  ├────────────────────────────────────────────────────────┼─────────────┤
  │ Total FY 2025 Capital Deployed                         │   $518.5M   │
  └────────────────────────────────────────────────────────┴─────────────┘
- R&D Platform Harmonization: Future development investments are focused on group platform sharing with Geely and Volvo, lowering engineering expenses for the Polestar 2 successor and Polestar 7.
- Tooling Monetization Transactions: Executed tooling transfer and financing agreements with Geely entities totaling $222.0 million for Polestar 4 and Polestar 5 production equipment in FY 2025.
- Capital Commitments: Contractual capital commitments for property, plant, and equipment stood at $12.6 million, alongside $371.1 million in contractual vehicle development and manufacturing agreements at year-end 2025.
Shareholding Pattern and Capital Structure
Polestar’s share capital is composed of Class A Ordinary Shares (and ADSs) and Class B Ordinary Shares carrying differential voting rights.
                 BENEFICIAL OWNERSHIP BREAKDOWN (FY 2025)
  ┌──────────────────────────────────────────────────────────┬───────────┐
  │ Shareholder Entity                                       │  Stake %  │
  ├──────────────────────────────────────────────────────────┼───────────┤
  │ Li Shufu / Geely Affiliates (PSD, Snita, Geely Sweden)   │   56.4%   │
  │ Volvo Car Corporation (Direct Holding)                   │   11.2%   │
  │ Sumitomo Mitsui Banking Corp (Feathertop Funding)        │    9.1%   │
  │ Standard Chartered Bank (Hong Kong) Limited              │    9.1%   │
  │ Natixis                                                  │    6.9%   │
  │ Banco Bilbao Vizcaya Argentaria, S.A. (BBVA)             │    6.9%   │
  │ All Directors and Executive Officers as a Group (10)     │   <0.1%   │
  └──────────────────────────────────────────────────────────┴───────────┘
Major Substantial Shareholders
The following table details beneficial shareholdings representing 5 percent or more of voting rights, alongside executive ownership, as disclosed in the Directors’ Report.
| Beneficial Owner Name | Ordinary Shares / ADSs Held | Ownership Percentage (%) | Regulatory Status / Classification |
| Li Shufu (Geely Controlling Entity) | 63,831,976 | 56.4% | Majority Controlling Shareholder (via PSD, Snita, Geely Sweden). |
| Volvo Car Corporation | 12,677,431 | 11.2% | Founding Industrial Shareholder. |
| Sumitomo Mitsui Banking Corporation (SMBC) | 10,341,261 | 9.1% | Institutional / Strategic Financial Investor. |
| Standard Chartered Bank (Hong Kong) Limited | 10,341,261 | 9.1% | Institutional / Strategic Financial Investor. |
| Natixis | 7,755,946 | 6.9% | Institutional Investor (Securities Purchase Agreement). |
| Banco Bilbao Vizcaya Argentaria, S.A. (BBVA) | 7,755,946 | 6.9% | Institutional Investor (Securities Purchase Agreement). |
| Prof. Dr. h.c. Winfried Vahland (Board Chair) | 25,279 | <1.0% (Less than 1%) | Independent Director Equity Holding. |
| Dr. Karl-Thomas Neumann (Director) | 5,989 | <1.0% (Less than 1%) | Independent Director Equity Holding. |
| Prof. Xiaojie (Laura) Shen (Director) | 4,933 | 0.0% (Direct Shares) | Independent Director Equity Holding. |
| Francesca Gamboni (Director) | 3,083 | 0.0% (Direct Shares) | Non-Executive Director Holding. |
| Cynthia Dubin (Director) | 1,920 | <1.0% (Direct Shares) | Independent Director Equity Holding. |
| Christine Gorjanc (Director) | 1,872 | 0.0% (Direct Shares) | Independent Director Equity Holding. |
| Quan (Joe) Zhang (Director) | 1,600 | <1.0% (Direct Shares) | Non-Executive Director Holding. |
| Michael Lohscheller (CEO) | 27,071 (PSUs) | 0.0% (Direct Shares) | Executive Equity Grant (Vesting Spring 2028). |
| Jean-François Mady (CFO) | 10,704 (PSUs) | 0.0% (Direct Shares) | Executive Equity Grant (Vesting Spring 2028). |
| All Directors & Executive Officers as a Group (10) | 46,185 | <1.0% | Executive and Board Leadership Ownership. |
Source: Polestar Automotive Holding UK PLC Annual Report and Financial Statements for the year ended 31 December 2025.
Future Strategy and Strategic Priorities
Management’s commercial strategy is focused on executing a targeted product expansion, transitioning to an active selling agency network, and maintaining operational cost discipline.
┌─────────────────────────────────────────────────────────────────────────┐
│                      STRATEGIC EXECUTION PILLARS                        │
├────────────────────┬─────────────────────┬──────────────────────────────┤
│ 1. Model Offensive │ 2. Agency Expansion │ 3. Operational Discipline    │
├────────────────────┼─────────────────────┼──────────────────────────────┤
│ • Polestar 5 GT    │ • Non-genuine agency│ • Fixed SG&A reduction       │
│ • Polestar 4 SUV   │ • 75% space growth  │ • Asset-light contract builds│
│ • Redesigned PS2   │ • High footfall hub │ • Tariff mitigation via KR/US│
│ • Polestar 7 (2028)│ • Importer channels │ • Platform sharing capex     │
└────────────────────┴─────────────────────┴──────────────────────────────┘
Three-Year Product Offensive (2026–2028)
In February 2026, Polestar announced a product offensive comprising four new models and variants designed to expand addressable BEV market coverage from 25% to approximately 55%:
- Polestar 5 Grand Tourer (Summer 2026): Production launch of the bonded aluminum halo GT.
- Polestar 4 SUV Variant (Q4 2026): Introduction of an estate/SUV body style based on the Polestar 4 platform.
- Redesigned Polestar 2 Successor (Early 2027): Complete redesign built on group shared architecture.
- Polestar 7 Compact Luxury SUV (2028): Entry into the high-volume compact luxury SUV segment, produced in Europe.
Commercial Network Restructuring
Polestar is accelerating the transition from a purely direct-to-consumer digital model to a non-genuine agency sales model. Under this structure, retail partners are incentivized to actively sell vehicles, coordinate test drives, and manage customer handovers, increasing showroom traffic and retail efficiency. Management plans to expand retail spaces across Europe and North America by 75% by year-end 2026.
Manufacturing Diversification and Tariff Mitigation
To protect margins against international trade barriers, Polestar is diversifying its assembly footprint outside China:
- Consolidating Polestar 3 manufacturing into Volvo Cars’ Charleston facility in the USA.
- Producing the Polestar 4 for global export at the Renault Korea plant in Busan, South Korea.
- Planning European contract manufacturing for the Polestar 7 in 2028.
Key Strengths
- Dedicated Pure-Play BEV Architecture: Europe’s only standalone pure electric brand without legacy ICE capital requirements or development overhead.
- Asset-Light Industrial Backing: Contract manufacturing agreements with Volvo Cars and Geely Group provide manufacturing capacity without the capital requirements of dedicated vehicle plants.
- Award-Winning Design and In-House R&D: Proprietary engineering in Gothenburg, Sweden, delivering bonded aluminum structures and recognized by international design awards (Red Dot Best of the Best, Euro NCAP).
- Extensive Global Service Infrastructure: Immediate customer access to 1,243 certified service points via the Volvo Cars network.
- Environmental Lifecycle Decoupling: Reductions in vehicle carbon footprints, supported by verified lifecycle assessments (LCAs) and targets to produce a climate-neutral car by 2030.
Key Challenges and Principal Risks
                  ENTERPRISE RISK HEATMAP REGISTER
  ┌─────────────────────────────────┬──────────────────────────────────┐
  │ Strategic / Operational Risks   │ Financial / Compliance Risks     │
  ├─────────────────────────────────┼──────────────────────────────────┤
  │ • Strategic Partner Dependency  │ • Going Concern Liquidity Needs  │
  │ • Global Macro Downturn & Demand│ • Debt Maturities & Covenants    │
  │ • Geopolitical Tariffs (US/EU)  │ • Internal Control Weaknesses    │
  │ • US ICTS Connected Car Rules   │ • FX Currency Transaction Risks  │
  └─────────────────────────────────┴──────────────────────────────────┘
1. Material Uncertainty Relating to Going Concern
Polestar generates recurring net losses ($(2,357.2) million in FY 2025) and negative operating cash flows ($(915.0) million), carrying net current liabilities of $3,519.6 million. The Group relies on refinancing short-term credit facilities, securing external equity/debt capital, and complying with lender covenants. Deloitte LLP issued an unmodified audit opinion containing an explanatory paragraph highlighting material uncertainty relating to going concern.
2. Dependency on Strategic Partner Infrastructure
The enterprise depends on commercial relationships with Volvo Cars, Geely Holding, and Renault Korea for contract manufacturing, parts supply, shared platforms, and service infrastructure. Interruptions or disputes within these partnerships could impact production schedules and vehicle delivery volumes.
3. Tariffs and Trade Regulatory Restrictions
Automotive import tariffs on Chinese-manufactured BEVs present margin headwinds:
- The United States implemented tariffs on Chinese-made electric vehicles and announced additional 25% tariffs on imported vehicles.
- The European Union imposed a 18.8% countervailing tariff on Polestar vehicles imported from China, added to the existing 10% base duty.
- U.S. Department of Commerce regulations on Information and Communications Technology Services (ICTS) for connected vehicles may restrict the import of hardware/software linked to Chinese supply chains, requiring supplier changes or regulatory exemptions.
4. Material Weaknesses in Internal Control Over Financial Reporting
Management and its independent auditor identified material weaknesses in internal control over financial reporting:
- Insufficient accounting personnel to execute timely reviews of technical accounting matters.
- Ineffective design and operation of controls governing journal entries, account reconciliations, and inventory net realizable value (NRV) calculations.
- Deficiencies in controls over IFRS 15 vehicle revenue recognition, buy-back classification, CGU impairment modeling, and IT general controls (SOC 1).
Environmental, Social, and Governance (ESG) Overview
Polestar integrates sustainability into its corporate strategy, focusing on four pillars: Climate Neutrality, Circularity, Transparency, and Inclusion.
                 POLESTAR 2040 CLIMATE ROADMAP MILESTONES
  ┌────────────────────────┬────────────────────────┬──────────────────┐
  │ Baseline Year (2020)   │ FY 2025 Actual Status  │ 2030 / 2040 Goals│
  ├────────────────────────┼────────────────────────┼──────────────────┤
  │ 45.9 tCO2e / vehicle   │ 31.7 tCO2e / vehicle   │ • 2030: 22.5 t   │
  │ Baseline footprint     │ 30.9% Decoupling       │   (-50% Intensity│
  │ Scope 1, 2, & 3 total  │ Achieved vs 2020 base  │ • 2040: Net-Zero │
  └────────────────────────┴────────────────────────┴──────────────────┘
Greenhouse Gas Emissions and Energy Performance
The table below presents Polestar’s audited global greenhouse gas emissions across Scope 1, Scope 2, and Scope 3 categories, reported in accordance with the Greenhouse Gas Protocol.
| Greenhouse Gas Category | Baseline Year (2020) | FY 2023 | FY 2024 (Restated) | FY 2025 | YoY Change (%) |
| Gross Scope 1 Emissions ($tCO_2e$) | 897 | 198 | 48 | 101 | +110.4% |
| Gross Scope 2 Emissions (Location-Based) | 4,175 | 7,401 | 15,365 | 6,544 | -57.4% |
| Gross Scope 2 Emissions (Market-Based) | 1,136 | 10,234 | 22,818 | 11,355 | -50.2% |
| Total Gross Scope 3 Indirect Emissions | 453,869 | 1,846,354 | 1,511,438 | 1,895,008 | +25.4% |
| — Purchased Goods and Services (Direct Materials) | 292,406 | 1,191,451 | 1,011,054 | 1,303,911 | +29.0% |
| — Upstream Transportation and Logistics | 77,128 | 156,989 | 127,024 | 156,135 | +22.9% |
| — Use of Sold Products (Customer Driving Phase) | 77,950 | 463,424 | 333,627 | 370,792 | +11.1% |
| — End-of-Life Treatment of Sold Vehicles | 5,013 | 26,335 | 31,213 | 58,044 | +86.0% |
| — Business Travel and Employee Commuting | 822 | 4,041 | 3,593 | 2,080 | -42.1% |
| Total Carbon Emissions (Market-Based $tCO_2e$) | 455,902 | 1,856,786 | 1,534,304 | 1,906,464 | +24.3% |
| Emissions Intensity per Vehicle Sold ($tCO_2e$) | 45.9 | 35.2 | 34.2 | 31.7 | -7.3% |
Source: Polestar Automotive Holding UK PLC Annual Report and Financial Statements for the year ended 31 December 2025.
Sustainability Targets and Decoupling Strategy
Polestar reduced its carbon intensity per vehicle sold from 45.90 tonnes of $CO_2e$ in 2020 to 31.70 tonnes of $CO_2e$ in FY 2025, representing a 30.9% reduction in per-vehicle emissions intensity. The progress was supported by higher sales of the Polestar 4, which carries a lower material carbon footprint than earlier models, alongside increased renewable electricity use across supply chains.
- 2030 Interim Target: Halve per-vehicle greenhouse gas emissions to 22.50 $tCO_2e$ per car sold (Management target).
- 2030 Climate-Neutral Vehicle Target: Deliver a cradle-to-gate climate-neutral production vehicle without carbon offsets through the Polestar 0 project (Management target).
- 2040 Climate Neutrality Target: Achieve net-zero greenhouse gas emissions across the value chain by reducing intensity by 90% and neutralizing remaining residual emissions with certified carbon removals (Management target).
Conclusion and Strategic Outlook
Polestar’s 2025 financial year demonstrated commercial scale, delivering 60,119 vehicles and generating $3,058.1 million in top-line revenue. The company has established a foundation through an expanding four-model EV line-up, a 28-market retail network, and an asset-light contract manufacturing model.
However, ongoing commercial execution depends on addressing significant financial and geopolitical risks. Management remains focused on executing liquidity plans, refinancing debt maturities, and navigating international import tariffs.
The three-year product offensive (2026–2028)—comprising the Polestar 5 GT, Polestar 4 SUV variant, redesigned Polestar 2, and European-built Polestar 7—is positioned to expand addressable BEV market coverage from 25% to 55%, supporting the company’s path toward long-term operational resilience.
Frequently Asked Questions (FAQ)
What is Polestar Automotive Holding UK PLC?
Polestar Automotive Holding UK PLC is a premium electric performance car brand headquartered in Gothenburg, Sweden, and registered as a public limited company in the UK. Founded in 2017 by Volvo Cars and Geely Group, it operates as a dedicated pure-play EV manufacturer listed on the NASDAQ exchange.
How many vehicles did Polestar deliver in FY 2025?
Polestar delivered 60,119 retail vehicles globally in FY 2025, representing a 34% increase compared to the 44,851 retail vehicles delivered during FY 2024.
What were Polestar’s primary financial results for FY 2025?
For the year ended December 31, 2025, Polestar reported total revenue of $3,058.1 million (up 50.3% YoY), a gross loss of $(1,083.9) million, an operating loss of $(2,009.3) million, and a net loss of $(2,357.2) million. The net loss was heavily impacted by $1,049.9 million in non-cash asset impairment charges.
What models are currently in Polestar’s vehicle lineup?
Polestar’s active portfolio includes the Polestar 2 (fastback sedan), Polestar 3 (luxury electric SUV), Polestar 4 (electric SUV coupé), and Polestar 5 (four-door performance GT). Future models in development include the Polestar 6 roadster and the Polestar 7 compact luxury SUV.
Where are Polestar vehicles manufactured?
Polestar utilizes an asset-light contract manufacturing model across multiple partner facilities:
- Polestar 2: Produced at the Volvo Cars facility in Taizhou, China.
- Polestar 3: Produced in Charleston, South Carolina, USA, and Chengdu, China.
- Polestar 4: Produced in Hangzhou Bay, China, and Busan, South Korea.
- Polestar 5: Produced in Wuhan, China.
- Polestar 7: Planned for production in Europe starting in 2028.
Who are the largest shareholders of Polestar?
The largest beneficial shareholder is Li Shufu (controlling Geely Holding Group affiliates, including PSD Investment Limited and Snita Holding B.V.), with a 56.4% voting stake. Volvo Car Corporation holds an 11.2% direct interest, while institutional investors include Sumitomo Mitsui Banking Corporation (9.1%), Standard Chartered Bank Hong Kong (9.1%), Natixis (6.9%), and BBVA (6.9%).
What is Polestar’s climate roadmap target?
Polestar targets reducing per-vehicle greenhouse gas emissions by 50% by 2030 (compared to a 2020 baseline), launching a cradle-to-gate climate-neutral production car by 2030 via the Polestar 0 project, and achieving net-zero climate neutrality across its value chain by 2040.
Official Site: https://investors.polestar.com